|
Plate fin heat sinks cooling encapsulated power transistors is one of the most
common configurations used for thermal management of electronics. One of the
difficulties associated with modeling such configurations is flow regime. Typically
power electronics requires fans and the flow inside most of the enclosure is turbulent.
However, inside heat sinks it is often not. Heat sinks present a considerable
resistance to the flow and with unshrouded heat sinks a lot of the air bypasses them
resulting in relatively low flow rate through the sink. The bypass phenomenon in
addition to narrow spacings between plate fins dampens turbulent fluctuations and
forces the flow to relaminarize.
Modeling mixed flows, which involve turbulent, transitional, and laminar areas is a
formidable challenge. If one is to assume flow as laminar to accurately model the flow
between plate fins, besides the impossibility of making such a set up to converge due
to oscillations associated with turbulence outside of the heat sink, one would
incorrectly model the rest of enclosure. So, one is required to use turbulence models
that can correctly describe the flow environment by transitioning back and forth
between laminar and turbulent regimes as flow conditions change.
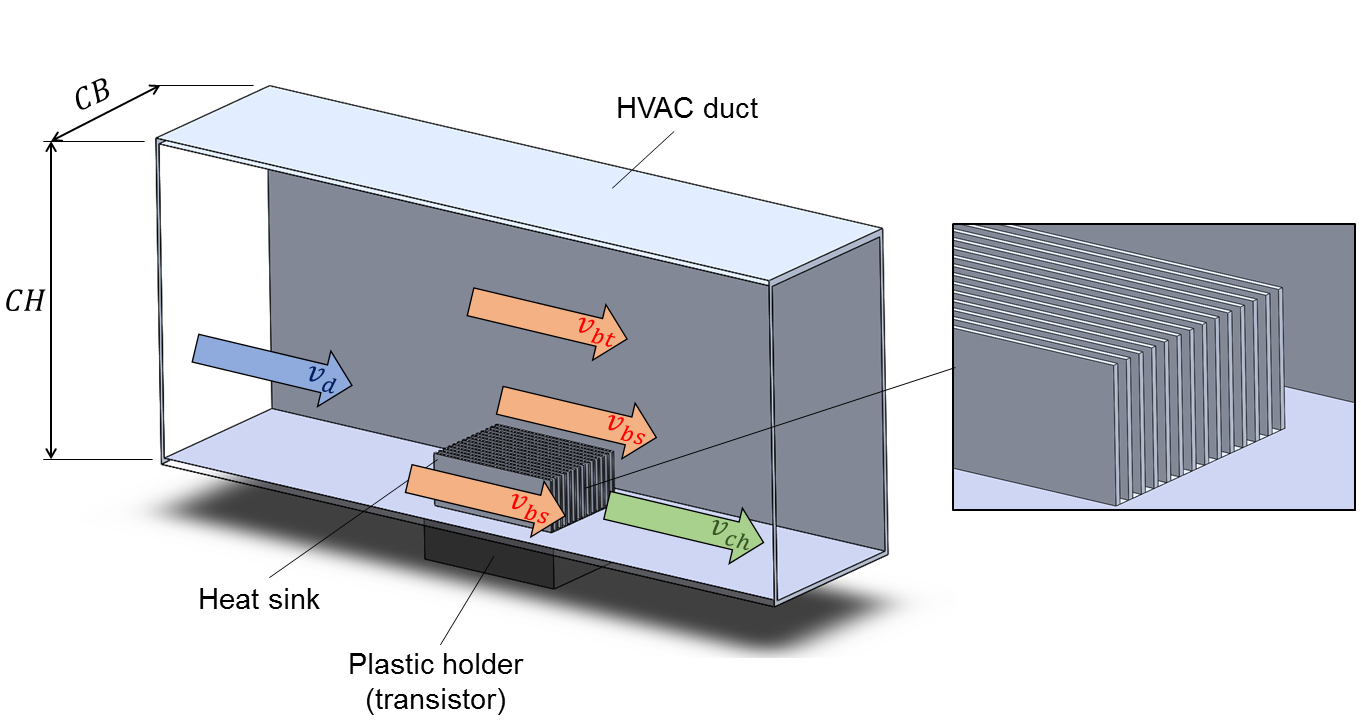
In this study we used Coolit with its specially tuned turbulence models to predict
flow in a wind tunnel with a flush-mounted heat sink on top of an encapsulated power
transistor. The computed results were compared to experiment by Ventola et al (2016).
The schematic of the experimental setup is shown in Figure 1.
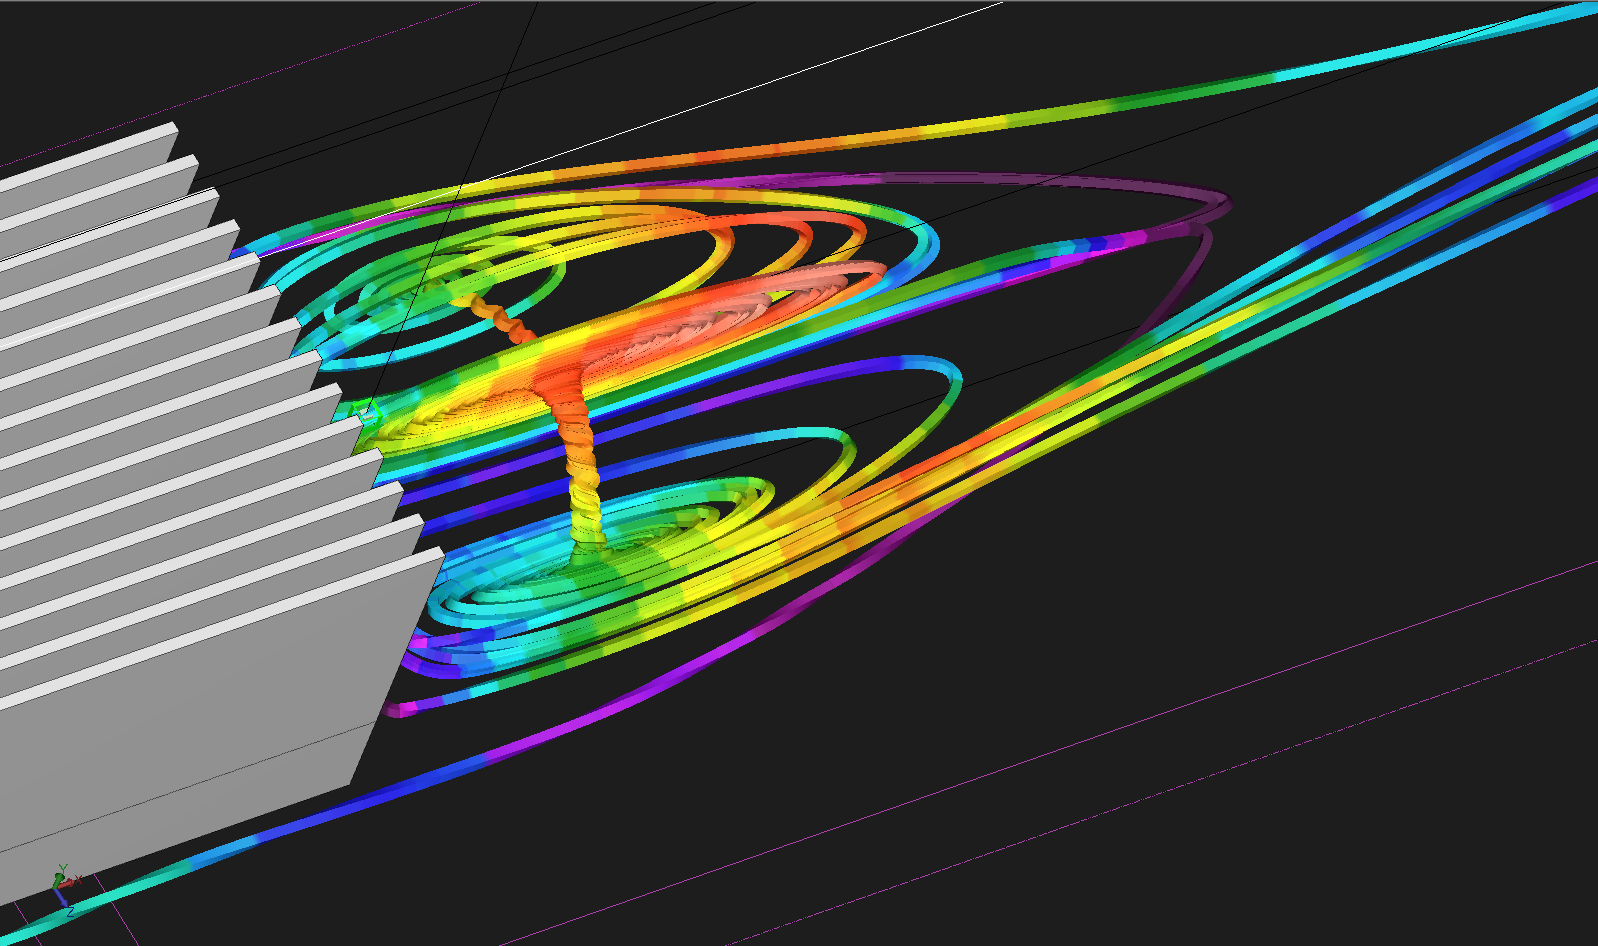
For detailed description of the setup refer to [1]. The authors of the paper wanted
to ensure that the airflow is simple enough to be described reasonably accurately
using approximate analytical models, which could then be used in heat sink
optimization studies. Therefore the heat sink was flush-mounted to prevent complex 3D
flow patterns such as the ones shown in Figure 2 where the heat sink is mounted on top
of the wind tunnel floor.
Seven flow configurations were considered with inlet flow velocity ranging from
5.6 to 13.9 m/s and the power transistor dissipating from 56.64 W to 87.32 W. The
cases presented excellent setup for this study with turbulent flow in most of the
wind tunnel and with largely laminar flow between plate fins.
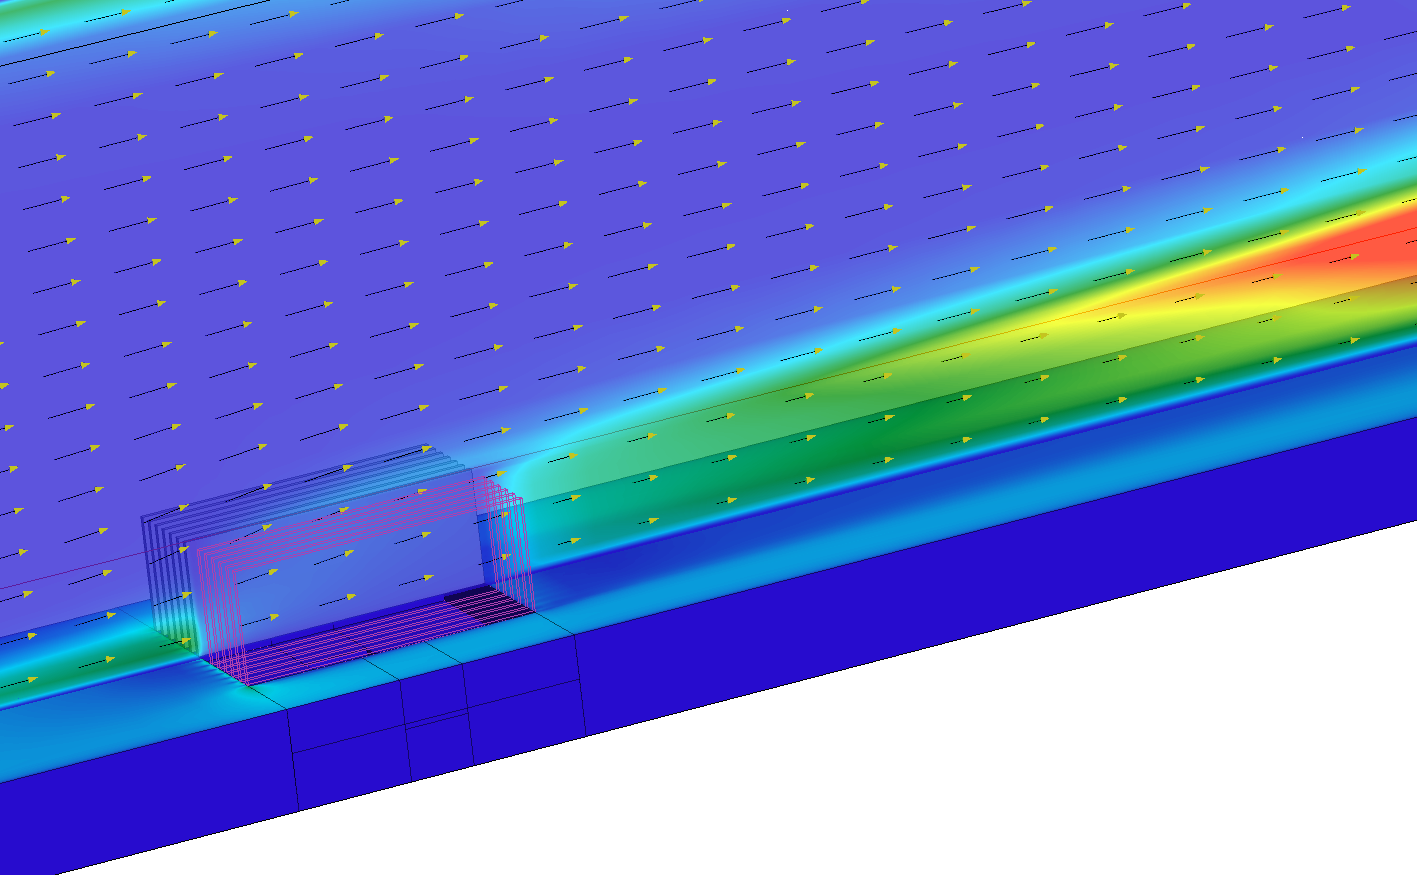
Figure 3 shows a cross section painted with the turbulence eddy viscosity ratio.
The section includes the area between plate fins. While the free flow turbulence in
this case reaches the robust 200 eddy viscosity ratio, the flow between fins is
laminar with the turbulence eddy viscosity ratio close to zero.
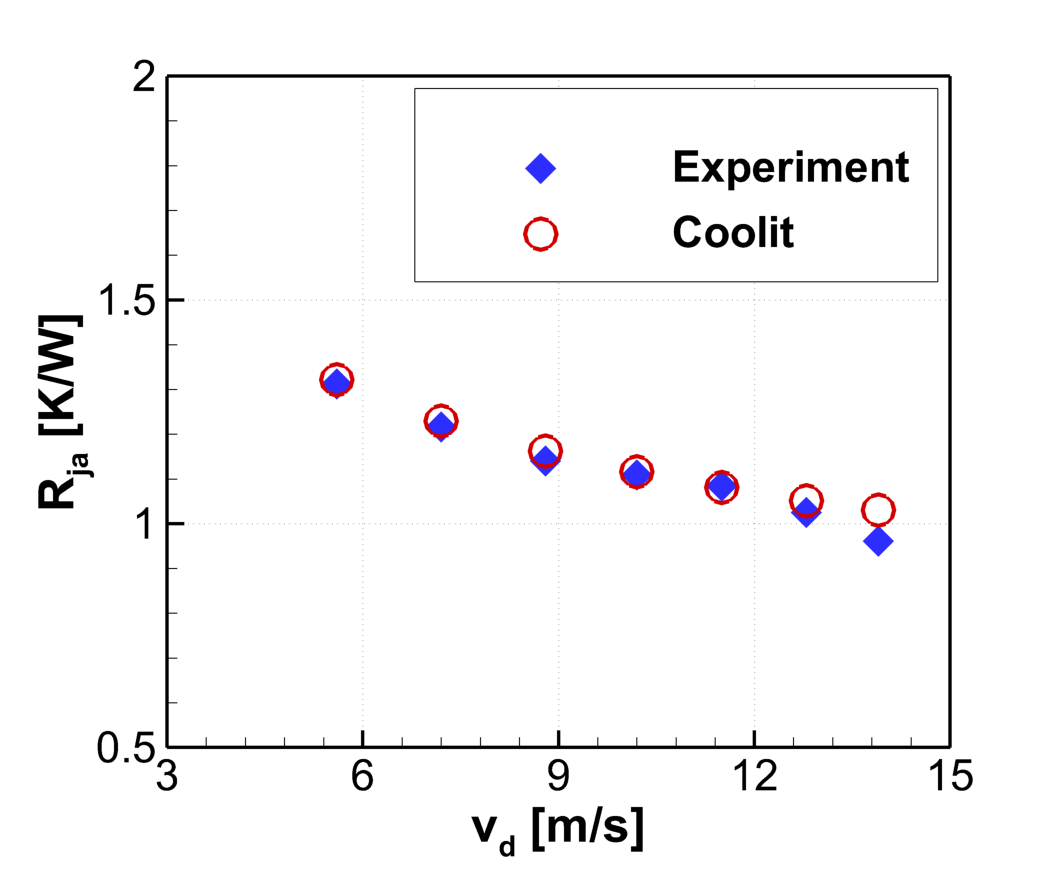
The case was run with several different grids to ensure grid independence of
computed results. The computed and experimental results for the junction-to-air
resistance, Rja = (Tjunction -
Tambient) / Power, plotted as a function of the inlet
velocity are shown in Figure 4. The computed results show good agreement with
experiment - well within the experiments margin of error stated in the paper.
References
Ventola,
L., Curcuruto, G., Fasano, M., Fotia, S., Pugliese, V., Chiavazzo, E. and Asinari, P.,
Unshrouded Plate Fin Heat Sinks for Electronics Cooling: Validation of a Comprehensive
Thermal Model and Cost Optimization in Semi-Active Configuration, Energies 8 (9), 2016.
|