|
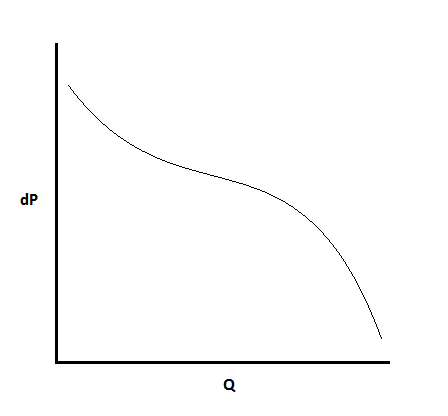
Most electronic devices involve fans, which are used to remove hot air from the system
in order to keep temperature under control. Fan specifications are provided by the
manufacturers with the most important characteristic for cooling being the fan (or
performance) curve that specifies the pressure drop across the fan as a function of flow
rate. A typical curve, Fig. 1, shows this dependence between pressure drop and flow
rate, where each flow rate has a unique value of pressure drop, as one would expect.
The one-to-one nature of pressure-flow rate dependence is very important for CFD codes
modeling electronic devices with fans. This is because CFD calculates a solution by
solving a quasi-time-dependent problem, usually starting from no-flow and gradually
building up from specified flow and heat sources until steady state flow is reached. As
the solution (and hence the flow) evolves, the flow rate through the fan changes, too.
With a one-to-one pressure-flow curve, such as Fig. 1, most CFD codes will have no
problem finding a solution because for each iteratively evolving flow rate there is only
one pressure drop.
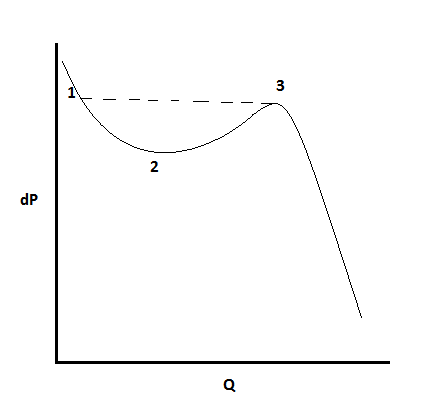
Another, still rather common, fan curve is shown in Fig. 2. The problem with such a
curve is immediately obvious: there are sections of the curve where a single pressure
drop corresponds to more than one flow rate. Such fan curves are discussed in the Fan
Physics section below. If you are lucky and the operating point for your system is to
the right of [3] on Fig. 2, you may get a solution. However, between 1-2-3 most CFD
codes will either fail to converge or converge to a wrong solution, with the operating
point often off the fan curve.
Some CFD codes recognize the problem up front and tell the user to modify the fan
curve, so that the multi-value section 1-2-3 is replaced with a one-to-one curve
connecting 1-3 (dashed line). This should help with convergence, but you might be
converging to a solution of a different problem, as the modified fan curve is not the
curve that was specified for your fan. Thus if your system is such that the fan actually
does operate to the left of [3] on Fig. 2, your solution will be wrong. In systems with
multiple fans, this will not even point out what is amiss, as you cannot know which
particular fan is at fault as they all affect each other's performance and, hence, the
operating point.
Daat engineers discovered that this apparently intractable problem has a unique
solution, despite the multivalue-ness of the fan curve. Their discovery not only
permits the solution of problems with complex and multivalue fan curves, it also
drastically speeds up the convergence rate. The advantage is especially noticeable for
problems with multi-value fan curves, even in cases where standard algorithms manage to
converge. An order of magnitude speed increases for such cases is not uncommon. Even
with one-to-one curves, the new algorithm converges 30%-100% faster.
Fan Curve Physics
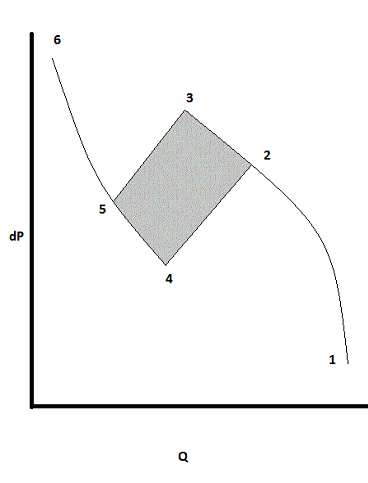
Consider the case of a fan in a wind tunnel. The fan starts operating with a fully
unobstructed flow - point 1 on Fig. 3. As the flow resistance increases, the flow rate
diminishes and the pressure drop rises along the curve 1-2-3. As the resistance further
increases, the corresponding flow rate decreases beyond point [2], and the fan goes
into an unstable regime. There could be different reasons for this, such as flow
separation and stall. At this point the flow rate drops sharply together with dP until
it reaches point [5]. During the unstable regime the fan may possibly vibrate and
generally display signs of "distress". Once the system resistance increases further,
the flow rates drops below point [5] and the fan regains the stable operation, so that
dP rises along 5-6.
One can conduct a different experiment by starting with a fully obstructed wind
tunnel to the left of point [6]. As the wind tunnel is gradually opened, flow
resistance is decreased, and the flow rate is increased along 6-5-4. At [4], the fan
becomes unstable until it regains stability at [2]. It then moves along 2-1 as the flow
resistance is further reduced.
The fan operation inside the 2-3-5-4 gray box is unstable and generally unknown. Fan
manufacturers show only a single line on their performance curve, rather than the
uncertainty box and an explanation of its origin.
|